Our performance
Read about our performance to find out how we’re delivering on our commitments to our customers. Here you can take a detailed look at our performance for the regulatory periods known as RIIO-GD1 (2013 – 2021) and RIIO-GD2 (2021-2026)
You’ll find a brief commentary on what each regulatory output means and how we performed against our targets.
RIIO GD2 (2021 – 2026)
Here you can take a detailed look at our performance since the start of the regulatory period known as RIIO-GD2 (2021 – 2026).
You’ll find a brief commentary on what each regulatory output means and how we performed against our targets.
Meeting consumer needs
Delivering the highest standards of service is at the heart of everything we do, keeping people safe and warm and industry powered up and providing extra help and support to those who need it most.
- 2021/22
- 2022/23
- 2023/24
- 2024/25
- 2025/26
Year: 2021/22
Customer Satisfaction
| Summary | Target | Actual | |
|---|---|---|---|
| Overall customer satisfaction | Our overall customer service score puts us in Ofgem's top performance band. | While there's no regulatory target, we aim for the perfect 10/10 score every time | 9.2/10 |
| Complaints metric | This number is based on complaint resolution times, the number of repeat complaints and Energy Ombudsman findings against NGN. We’re aiming for our score to be as low as possible. | 5.0 | 2.8 |
| Guaranteed Standards of Performance | If we fall short of our high standards, we pay compensation to our customers. This is how much compensation we’ve paid. | N/A | £0.68 million |
Carbon monoxide (CO) awareness
| Summary | Target | Actual | |
|---|---|---|---|
| Awareness campaigns | Our carbon monoxide awareness campaigns have reached more customers than any other gas distributor. | N/A | 6,009,334 |
| CO awareness visits and surveys | The number of customers that have had a CO awareness visit or completed one of our CO surveys | 50,000 (5 years) | 17,995 |
Understanding dangers of CO
| Summary | Target | Actual | |
|---|---|---|---|
| Average score before visit | We ask customers to rate their knowledge of CO out of ten before they were educated. | N/A | 5.88/10 |
| Average score after visit | We ask customers to rate their knowledge of CO out of ten after they were educated. | N/A | 7.55/10 |
Priority Services Register (PSR)
| Summary | Target | Actual | |
|---|---|---|---|
| Number of customers referred onto the PSR | Being registered on the PSR gives you access to extra help and support should you need it, and peace of mind that you will be prioritised for reconnection if you lose your energy supply. | 25,000 (5,000 per year) | 4,908 |
| Average satisfaction score of customers on the PSR impacted by NGN | We aim to deliver the highest standards of service for all of our customers, including those who need additional help and support, whether that’s on a temporary or more permanent basis. Extension Scheme in 2021. | N/A | 9.38/10 |
Fuel Poverty
| Summary | Target | Actual | |
|---|---|---|---|
| Number of Fuel Poor Network Extension Scheme Connections | We’ve seen a significant decline in the number of people in fuel poverty connecting to our network since Ofgem reviewed its eligibility criteria for its Fuel Poor Network Extension Scheme in 2021. | N/A | 854 |
Year: 2022/23
Customer Satisfaction
| Summary | Target | Actual | |
|---|---|---|---|
| Overall customer satisfaction | Our overall customer service score puts us in Ofgem's top performance band. | While there's no regulatory target, we aim for the perfect 10/10 score every time | 9.27/10 |
| Complaints metric | This number is based on complaint resolution times, the number of repeat complaints and Energy Ombudsman findings against NGN. We’re aiming for our score to be as low as possible. | 5.0 | 1.8 |
| Guaranteed Standards of Performance | If we fall short of our high standards, we pay compensation to our customers. This is how much compensation we’ve paid. | N/A | £0.42 million |
Carbon monoxide (CO) awareness
| Summary | Target | Actual | |
|---|---|---|---|
| Awareness campaigns | Our carbon monoxide awareness campaigns have reached more customers than any other gas distributor. | N/A | 803,186 |
| CO awareness visits and surveys | The number of customers that have had a CO awareness visit or completed one of our CO surveys | 50,000 (5 years) | 17,996 |
Understanding dangers of CO
| Summary | Target | Actual | |
|---|---|---|---|
| Average score before visit | We ask customers to rate their knowledge of CO out of ten before they were educated. | N/A | 6.28/10 |
| Average score after visit | We ask customers to rate their knowledge of CO out of ten after they were educated. | N/A | 7.71/10 |
Priority Services Register (PSR)
| Summary | Target | Actual | |
|---|---|---|---|
| Number of customers referred onto the PSR | Being registered on the PSR gives you access to extra help and support should you need it, and peace of mind that you will be prioritised for reconnection if you lose your energy supply. | 25,000 (5,000 per year) | 8,925 |
| Average satisfaction score of customers on the PSR impacted by NGN | We aim to deliver the highest standards of service for all of our customers, including those who need additional help and support, whether that’s on a temporary or more permanent basis. Extension Scheme in 2021. | N/A | 9.32/10 |
Fuel Poverty
| Summary | Target | Actual | |
|---|---|---|---|
| Number of Fuel Poor Network Extension Scheme Connections | We’ve seen a significant decline in the number of people in fuel poverty connecting to our network since Ofgem reviewed its eligibility criteria for its Fuel Poor Network Extension Scheme in 2021. | N/A | 185 |
Year: 2023/24
Customer Satisfaction
| Summary | Target | Actual | |
|---|---|---|---|
| Overall customer satisfaction | Our overall customer service score puts us in Ofgem's top performance band. | While there's no regulatory target, we aim for the perfect 10/10 score every time | 9.26/10 |
| Complaints metric | This number is based on complaint resolution times, the number of repeat complaints and Energy Ombudsman findings against NGN. We’re aiming for our score to be as low as possible. | 5.0 | 1.9 |
| Guaranteed Standards of Performance | If we fall short of our high standards, we pay compensation to our customers. This is how much compensation we’ve paid. | N/A | £0.35 million |
Carbon monoxide (CO) awareness
| Summary | Target | Actual | |
|---|---|---|---|
| Awareness campaigns | Our carbon monoxide awareness campaigns have reached more customers than any other gas distributor. | N/A | 10,665,683 |
| CO awareness visits and surveys | The number of customers that have had a CO awareness visit or completed one of our CO surveys | 50,000 (5 years) | 18,410 |
Understanding dangers of CO
| Summary | Target | Actual | |
|---|---|---|---|
| Average score before visit | We ask customers to rate their knowledge of CO out of ten before they were educated. | N/A | 6.33/10 |
| Average score after visit | We ask customers to rate their knowledge of CO out of ten after they were educated. | N/A | 7.69/10 |
Priority Services Register (PSR)
| Summary | Target | Actual | |
|---|---|---|---|
| Number of customers referred onto the PSR | Being registered on the PSR gives you access to extra help and support should you need it, and peace of mind that you will be prioritised for reconnection if you lose your energy supply. | 25,000 (5,000 per year) | 10,003 |
| Average satisfaction score of customers on the PSR impacted by NGN | We aim to deliver the highest standards of service for all of our customers, including those who need additional help and support, whether that’s on a temporary or more permanent basis. Extension Scheme in 2021. | N/A | 9.34/10 |
Fuel Poverty
| Summary | Target | Actual | |
|---|---|---|---|
| Number of Fuel Poor Network Extension Scheme Connections | We’ve seen a significant decline in the number of people in fuel poverty connecting to our network since Ofgem reviewed its eligibility criteria for its Fuel Poor Network Extension Scheme in 2021. | N/A | 100 |
Year: 2024/25
Customer Satisfaction
| Summary | Target | Actual | |
|---|---|---|---|
| Overall customer satisfaction | Our overall customer service score puts us in Ofgem's top performance band. | While there's no regulatory target, we aim for the perfect 10/10 score every time | 9.21/10 |
| Complaints metric | This number is based on complaint resolution times, the number of repeat complaints and Energy Ombudsman findings against NGN. We’re aiming for our score to be as low as possible. | 5.0 | 1.39 |
| Guaranteed Standards of Performance | If we fall short of our high standards, we pay compensation to our customers. This is how much compensation we’ve paid. | N/A | £0.33 million |
Carbon monoxide (CO) awareness
| Summary | Target | Actual | |
|---|---|---|---|
| Awareness campaigns | Our carbon monoxide awareness campaigns have reached more customers than any other gas distributor. | N/A | 74,196,123 |
| CO awareness visits and surveys | The number of customers that have had a CO awareness visit or completed one of our CO surveys | 50,000 (5 years) | 23,004 |
Understanding dangers of CO
| Summary | Target | Actual | |
|---|---|---|---|
| Average score before visit | We ask customers to rate their knowledge of CO out of ten before they were educated. | N/A | 6.05/10 |
| Average score after visit | We ask customers to rate their knowledge of CO out of ten after they were educated. | N/A | 7.67/10 |
Priority Services Register (PSR)
| Summary | Target | Actual | |
|---|---|---|---|
| Number of customers referred onto the PSR | Being registered on the PSR gives you access to extra help and support should you need it, and peace of mind that you will be prioritised for reconnection if you lose your energy supply. | 25,000 (5,000 per year) | 11,889 |
| Average satisfaction score of customers on the PSR impacted by NGN | We aim to deliver the highest standards of service for all of our customers, including those who need additional help and support, whether that’s on a temporary or more permanent basis. Extension Scheme in 2021. | N/A | 9.32/10 |
Fuel Poverty
| Summary | Target | Actual | |
|---|---|---|---|
| Number of Fuel Poor Network Extension Scheme Connections | We’ve seen a significant decline in the number of people in fuel poverty connecting to our network since Ofgem reviewed its eligibility criteria for its Fuel Poor Network Extension Scheme in 2021. | N/A | 108 |
Year: 2025/26
Customer Satisfaction
| Summary | Target | Actual | |
|---|---|---|---|
| Overall customer satisfaction | Our overall customer service score puts us in Ofgem's top performance band. | While there's no regulatory target, we aim for the perfect 10/10 score every time | 9.31 |
| Complaints metric | This number is based on complaint resolution times, the number of repeat complaints and Energy Ombudsman findings against NGN. We’re aiming for our score to be as low as possible. | 5.0 | 1.84 |
| Guaranteed Standards of Performance | If we fall short of our high standards, we pay compensation to our customers. This is how much compensation we’ve paid. | N/A | £0.37m |
Carbon monoxide (CO) awareness
| Summary | Target | Actual | |
|---|---|---|---|
| Awareness campaigns | Our carbon monoxide awareness campaigns have reached more customers than any other gas distributor. | N/A | 6,552,468 |
| CO awareness visits and surveys | The number of customers that have had a CO awareness visit or completed one of our CO surveys | 50,000 (5 years) | 24,442 |
Understanding dangers of CO
| Summary | Target | Actual | |
|---|---|---|---|
| Average score before visit | We ask customers to rate their knowledge of CO out of ten before they were educated. | N/A | 6.03/10 |
| Average score after visit | We ask customers to rate their knowledge of CO out of ten after they were educated. | N/A | 7.63/10 |
Priority Services Register (PSR)
| Summary | Target | Actual | |
|---|---|---|---|
| Number of customers referred onto the PSR | Being registered on the PSR gives you access to extra help and support should you need it, and peace of mind that you will be prioritised for reconnection if you lose your energy supply. | 25,000 (5,000 per year) | 15,835 |
| Average satisfaction score of customers on the PSR impacted by NGN | We aim to deliver the highest standards of service for all of our customers, including those who need additional help and support, whether that’s on a temporary or more permanent basis. Extension Scheme in 2021. | N/A | 9.32/10 |
Fuel Poverty
| Summary | Target | Actual | |
|---|---|---|---|
| Number of Fuel Poor Network Extension Scheme Connections | We’ve seen a significant decline in the number of people in fuel poverty connecting to our network since Ofgem reviewed its eligibility criteria for its Fuel Poor Network Extension Scheme in 2021. | N/A | 95 |
Keeping our network safe and resilient
We’re investing in our network to ensure that we continue to keep our customers safe, warm and connected. The average customer experiences an interruption to their gas supply once in every 260 years. You can rely on us.
- 2021/22
- 2022/23
- 2023/24
- 2024/25
- 2025/26
Year: 2021/22
Upgrading our network
| Summary | Target | Actual | |
|---|---|---|---|
| Tier 1 Mains Replacement Programme | The length of ageing metal pipes that we're replacing with modern plastic equivalents which are more durable | 428km | 437.4km |
| Tier 1 Services | The amount of smaller pipes that connect homes to the gas mains in the street that we're replacing with modern plastic equivalents. | 29,494 | 30,220 |
| Gas holder demolition | Gas holders are large structures which aren’t required for todays modern gas network - we've been carefully removing them | 23 (5 years) | 5 |
| % of repairs completed within 28 days | We aim to carry out pipe repairs as quickly as possible | N/A | 98.4% |
Emergency Response
| Summary | Target | Actual | |
|---|---|---|---|
| Amount of uncontrolled gas escapes attended within 1 hour | GD2 total average is 99.91% for every year | 97% | 99.75% |
| Amount of controlled gas escapes attended within 2 hours | GD2 total average is 99.79% for every year | 97% | 99.95% |
| Duration of unplanned service interruptions | The average time customers were unexpectedly without gas | No more than 10 hours | 5 hours |
Year: 2022/23
Upgrading our network
| Summary | Target | Actual | |
|---|---|---|---|
| Tier 1 Mains Replacement Programme | The length of ageing metal pipes we've replaced with modern plastic equivalents | 428km | 430.37km |
| Tier 1 Services | The amount of smaller pipes that connect homes to the gas mains in the street that we've replaced with modern plastic equivalents. | 29,494 | 28,688 |
| Gas holder demolition | Gas holders are large structures which aren’t required for todays modern gas network - we've been carefully removing them | 23 | 10 |
| % of repairs completed within 28 days | We aim to carry out pipe repairs as quickly as possible. | N/A | 98.0% |
Emergency Response
| Summary | Target | Actual | |
|---|---|---|---|
| Amount of uncontrolled gas escapes attended within 1 hour | GD2 total average is 99.91% for every year | 97% | 99.55% |
| Amount of controlled gas escapes attended within 2 hours | GD2 total average is 99.79% for every year | 97% | 99.69% |
| Duration of unplanned service interruptions | The average time customers were unexpectedly without gas | No more than 10 hours | 5.60 hours |
Year: 2023/24
Upgrading our network
| Summary | Target | Actual | |
|---|---|---|---|
| Tier 1 Mains Replacement Programme | The length of ageing metal pipes replaced with modern plastic equivalents | 428km | 469.6km |
| Tier 1 Services | The amount of smaller pipes that connect homes to the gas mains in the street that we've replaced with modern plastic equivalents. | 29,494 | 31,929 |
| Gas holder demolition | Gas holders are large structures which aren’t required for todays modern gas network - we've been carefully removing them | 23 (5 years) | 5 |
| % of repairs completed within 28 days | We aim to carry out pipe repairs as quickly as possible. | N/A | 98.4% |
Emergency Response
| Summary | Target | Actual | |
|---|---|---|---|
| Amount of uncontrolled gas escapes attended within 1 hour | GD2 total average is 99.91% for every year | 97% | 99.81% |
| Amount of controlled gas escapes attended within 2 hours | GD2 total average is 99.79% for every year | 97% | 99.93% |
| Duration of unplanned service interruptions | The average time customers were unexpectedly without gas | No more than 10 hours | 4.03 hours |
Year: 2024/25
Upgrading our network 24/25
| Summary | Target | Actual | |
|---|---|---|---|
| Tier 1 Mains Replacement Programme | The length of ageing metal pipe we've replaced with modern plastic equivalents | 428km | 447.7km |
| Tier 1 Services | The amount of smaller pipes that connect homes to the gas mains in the street that we've replaced with modern plastic equivalents. | 29,494 | 30,131 |
| Gas holder demolition | In 2024/25 we removed and decommissioned the final three gas holders (large structures which aren’t required for todays modern gas network) delivering this programme a year ahead of target. | 23 (5 years) | 3 |
| % of repairs completed within 28 days | We aim to carry out pipe repairs as quickly as possible. | N/A | 98.7% |
Emergency Response
| Summary | Target | Actual | |
|---|---|---|---|
| Amount of uncontrolled gas escapes attended within 1 hour | GD2 total average is 99.91% for every year | 97% | 99.90% |
| Amount of controlled gas escapes attended within 2 hours | GD2 total average is 99.79% for every year | 97% | 99.99% |
| Duration of unplanned service interruptions | The average time customers were unexpectedly without gas | No more than 10 hours | 5.18 hours |
Year: 2025/26
Upgrading our network
| Summary | Target | Actual | |
|---|---|---|---|
| Tier 1 Mains Replacement Programme | We invested £270m in our mains replacement programme between April 2021 and March 2026, replacing ageing metal pipes with modern plastic ones which are more durable and less prone to leaks. | 428km | 431.6km |
| Tier 1 Services | We invested over £47.8 million between April 2021 and March 2026 replacing the smaller pipes that connect homes to the gas mains in the street with modern plastic equivalents. | 29,494 | 29,361 |
| Gas holder demolition | In 2024/25 we removed and decommissioned the final three gas holders (large structures which aren’t required for todays modern gas network) delivering this programme a year ahead of target. | 23 (5 years) | 0 - Completed |
| % of repairs completed within 28 days | We aim to carry out pipe repairs as quickly as possible. | N/A | 98.7% |
Emergency Response
| Summary | Target | Actual | |
|---|---|---|---|
| Amount of uncontrolled gas escapes attended within 1 hour | GD2 total average is 99.91% for every year | 97% | 99.90% |
| Amount of controlled gas escapes attended within 2 hours | GD2 total average is 99.79% for every year | 97% | 99.95% |
| Duration of unplanned service interruptions | The average time customers were unexpectedly without gas | No more than 10 hours | 4.15 hours |
Delivering sustainably
Our vision is for a fairer, greener future for the North of England and we have a great responsibility to ensure that we operate our business in a sustainable way. It’s not just about reducing our carbon footprint but delivering positive environmental outcomes for our Northern communities.
- 2021/22
- 2022/23
- 2023/24
- 2024/25
- 2025/26
Year: 2021/22
Business Carbon Footprint
| Summary | Target | Actual | |
|---|---|---|---|
| Non Shrinkage business carbon footprint for Scope 1 and 2 tCO2e | Scope 1 relates to the emissions that we control including our energy usage in our buildings and fleet. Scope 2 emissions come from where the energy that we use is produced, and are measured in tonnes of carbon emission. | 4,943 | 4,785 |
| Non Shrinkage business carbon for Key Scope 3 tCO2e | Scope 3 emissions relate other emission produced by our value chain and are measured in tonnes of carbon emissions. | 15,200 | 15,198 |
| Scope 1, 2 and key 3 business carbon footprint tCO2e | Scope 1 relates to the emissions that we control including our energy usage in our buildings and fleet, Scope 2 emissions come from where the energy that we use is produced, and are measured in tonnes of carbon emissions and Key scope 3 emissions are the 15 categories of indirect emissions in our value chain. | 20,241 | 19,985 |
| Total scope 1, 2 and 3 business carbon footprint tCO2e | This is the total emissions generated directly and indirectly by our business, as well as all emissions in our value chain. | N/A | 27,191 |
| Scope 1 Shrinkage tCO2e | This relates to emission caused by gas leakage from our network and are measured in tonnes of carbon emissions. | N/A | 363,345 |
Year: 2022/23
Business Carbon Footprint
| Summary | Target | Actual | |
|---|---|---|---|
| Non Shrinkage business carbon footprint for Scope 1 and 2 tCO2e | Scope 1 relates to the emissions that we control including our energy usage in our buildings and fleet. Scope 2 emissions come from where the energy that we use is produced, and are measured in tonnes of carbon emission. | 4,527 | 5,099 |
| Non Shrinkage business carbon for Key Scope 3 tCO2e | Scope 3 emissions relate other emission produced by our value chain and are measured in tonnes of carbon emissions. | 15,030 | 15,233 |
| Scope 1, 2 and key 3 business carbon footprint tCO2e | Scope 1 relates to the emissions that we control including our energy usage in our buildings and fleet, Scope 2 emissions come from where the energy that we use is produced, and are measured in tonnes of carbon emissions and Key scope 3 emissions are the 15 categories of indirect emissions in our value chain. | 19,557 | 20,333 |
| Total scope 1, 2 and 3 business carbon footprint tCO2e | This is the total emissions generated directly and indirectly by our business, as well as all emissions in our value chain. | N/A | 26,730 |
| Scope 1 Shrinkage tCO2e | This relates to emission caused by gas leakage from our network and are measured in tonnes of carbon emissions. | N/A | 328,250 |
Year: 2023/24
Business Carbon Footprint
| Summary | Target | Actual | |
|---|---|---|---|
| Non Shrinkage business carbon footprint for Scope 1 and 2 tCO2e | Scope 1 relates to the emissions that we control including our energy usage in our buildings and fleet. Scope 2 emissions come from where the energy that we use is produced, and are measured in tonnes of carbon emission. | 4,011 | 5,102 |
| Non Shrinkage business carbon for Key Scope 3 tCO2e | Scope 3 emissions relate other emission produced by our value chain and are measured in tonnes of carbon emissions. | 14,724 | 17,355 |
| Scope 1, 2 and key 3 business carbon footprint tCO2e | Scope 1 relates to the emissions that we control including our energy usage in our buildings and fleet, Scope 2 emissions come from where the energy that we use is produced, and are measured in tonnes of carbon emissions and Key scope 3 emissions are the 15 categories of indirect emissions in our value chain. | 18,735 | 22,457 |
| Total scope 1, 2 and 3 business carbon footprint tCO2e | This is the total emissions generated directly and indirectly by our business, as well as all emissions in our value chain. | N/A | 28,878 |
| Scope 1 Shrinkage tCO2e | This relates to emission caused by gas leakage from our network and are measured in tonnes of carbon emissions. | N/A | 308,973 |
Year: 2024/25
Business Carbon Footprint
| Summary | Target | Actual | |
|---|---|---|---|
| Non Shrinkage business carbon footprint for Scope 1 and 2 tCO2e | Scope 1 relates to the emissions that we control including our energy usage in our buildings and fleet. Scope 2 emissions come from where the energy that we use is produced, and are measured in tonnes of carbon emission. | 3,688 | 5,122 |
| Non Shrinkage business carbon for Key Scope 3 tCO2e | Scope 3 emissions relate other emission produced by our value chain and are measured in tonnes of carbon emissions. | 14,457 | 16,705 |
| Scope 1, 2 and key 3 business carbon footprint tCO2e | Scope 1 relates to the emissions that we control including our energy usage in our buildings and fleet, Scope 2 emissions come from where the energy that we use is produced, and are measured in tonnes of carbon emissions and Key scope 3 emissions are the 15 categories of indirect emissions in our value chain. | 18,145 | 21,827 |
| Total scope 1, 2 and 3 business carbon footprint tCO2e | This is the total emissions generated directly and indirectly by our business, as well as all emissions in our value chain. | N/A | 28,226 |
| Scope 1 Shrinkage tCO2e | This relates to emission caused by gas leakage from our network and are measured in tonnes of carbon emissions. | N/A | 28,409 |
Year: 2025/26
Business Carbon Footprint
| Summary | Target | Actual | |
|---|---|---|---|
| Non Shrinkage business carbon footprint for Scope 1 and 2 tCO2e | Scope 1 relates to the emissions that we control including our energy usage in our buildings and fleet. Scope 2 emissions come from where the energy that we use is produced, and are measured in tonnes of carbon emission. | 3,612 | 5,422 |
| Non Shrinkage business carbon for Key Scope 3 tCO2e | Scope 3 emissions relate other emission produced by our value chain and are measured in tonnes of carbon emissions. | 14,191 | 16,607 |
| Scope 1, 2 and key 3 business carbon footprint tCO2e | Scope 1 relates to the emissions that we control including our energy usage in our buildings and fleet, Scope 2 emissions come from where the energy that we use is produced, and are measured in tonnes of carbon emissions and Key scope 3 emissions are the 15 categories of indirect emissions in our value chain. | 17,803 | 22,029 |
| Total scope 1, 2 and 3 business carbon footprint tCO2e | This is the total emissions generated directly and indirectly by our business, as well as all emissions in our value chain. | N/A | 28,409 |
| Scope 1 Shrinkage tCO2e | This relates to emission caused by gas leakage from our network and are measured in tonnes of carbon emissions. | N/A | 297,653 |
Towards Net Zero
In its RIIO-2 Final Determination, Ofgem established a Net Zero and Re-opener Development Fund Use it or Lose it allowance to fund net zero facilitation projects, and to allow for early development work on projects to be brought forward at a later stage through other RIIO-GD2 net zero-related mechanisms. Northern Gas Networks were awarded £4.5m under this allowance.
We have strategically allocated our Use It or Lose It allowance to projects focused on defining the role of gas in achieving the UK’s Net Zero targets. This included the development of a comprehensive energy futures strategy and roadmap, designed to assess whole-system impacts and guide effective deployment of resources.
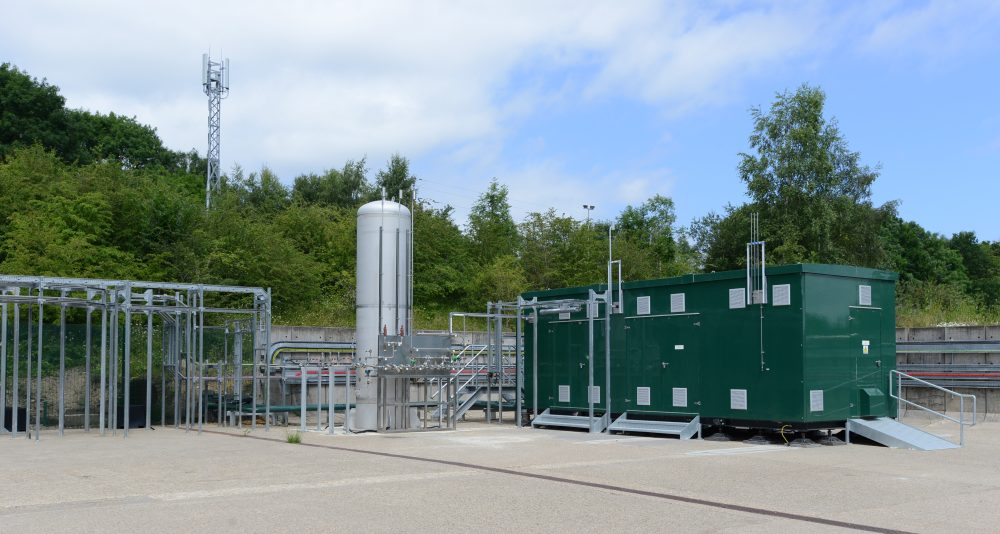
East Coast Hydrogen
East Coast Hydrogen is a 15-year strategic infrastructure programme led by Northern Gas Neworks, Cadent, and National Gas, aiming to establish a hydrogen network across northern England. By connecting hydrogen producers, users, and storage facilities through a mix of new and repurposed pipelines. East Coast Hydrogen will support industrial and commercial decarbonisation while creating significant economic and employment opportunities.
East Coast Hydrogen is a partnership between Northern Gas Networks, National Gas and Cadent to connect hydrogen production, storage and industry across Teesside, the Humber and the wider East Coast. The project will help cut carbon emissions from some of the UK’s most energy-intensive industries, while supporting jobs, investment and the transition to a low-carbon energy system. Following Ofgem’s approval of funding in June 2025, the project entered the Front End Engineering Design (FEED) phase. Since then, work has progressed on developing potential pipeline routes in Humber and Teesside, undertaking environmental assessments, engaging with communities and stakeholders, and submitting early environmental plans to the Planning Inspectorate. The project has secured growing support from key offtakers and could generate £1.2 billion for the regional economy while supporting up to 1,200 jobs.

Net Zero Energy Planning Tool
Navigator, funded through the Network Innovation Allowance (NIA), is developing a whole-system energy planning tool to help local authorities, policymakers and energy networks make informed net zero decisions. By combining data on energy demand, network capacity, costs, emissions and social factors such as fuel poverty, the tool enables users to test different decarbonisation pathways, understand trade-offs and identify the best solutions for their region. Over the past year, Navigator has evolved from concept to reality and is now being used to support real-world planning and investment decisions.
The Blending Implementation Programme is a collaboratively NIA-funded initiative led by Northern Gas Networks, Cadent, SGN, Wales & West Utilities and National Gas. The project aims to undertake the detailed design and governance impacts of the market and operational changes required to enable hydrogen blending into the UK gas network.
Key outputs include creating a single process for managing hydrogen blending applications, agreeing consistent connection rules across all networks, updating charging arrangements to support blending, and developing the forecasting and communications approach. This will give better visibility of hydrogen content and gas quality, while helping networks forecast demand and plan operations more effectively.